Qualitative research involves gathering and analysing non-numerical data, often to delve into complex, nuanced and context-dependent topics. There are various techniques to organise, categorise and make sense of qualitative data to uncover underlying patterns, themes and insights. Here we’ll discuss how to start ‘data coding’ a technique to identify and select the groups to use in organising your qualitative data, and how you can use Protolyst to code your data without any programming involved.
What is Data Coding?
To identify any patterns or trends within your data, you will need to extract and reorganise the data in your Sources. Coding your data identifies groups which you will use to categorise your qualitative data. During this process you are reconfiguring your data so that you can analyse words in a similar way to analysing numbers.
When working with quantitative data, categorising it into groups is straightforward. Once groups have been determined, you can easily identify which data falls into your chosen groups. However when you are reviewing qualitative data, grouping is not as straightforward. Numerical values are discrete, but in qualitative data there are multiple combinations of words that can have the same underlying sentiment or ‘value’.
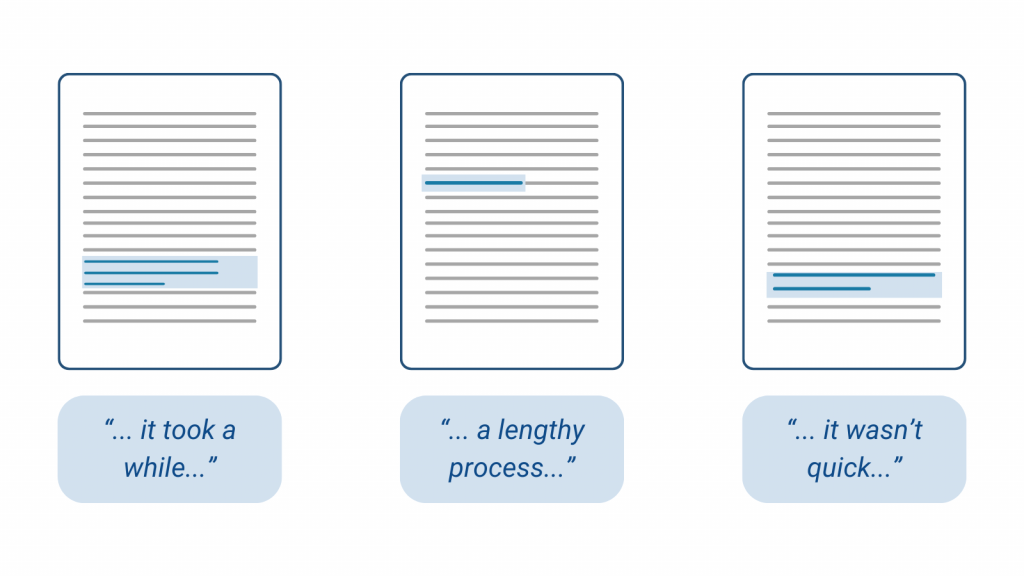
As you review your qualitative data, you are looking to interpret the ‘value’ of your data so that you can explore how that ‘value’ is shared across your other sources. These ‘values’ you identify are what become your codes.
As you read other sources and find other data that shares the same ‘value’, you can label it so that you can identify and collect all your data with a shared value together. To keep these labels manageable, each label should capture the essence of the content in a few words or a short phrase i.e. a coded definition, hence calling them codes.
Using these codes as Labels for your data allows you to group your snippets of text that share the same ‘value’ together from multiple sources for further analysis and interpretation.
Deciding on your Codes
The codes you use should be specific to your research question, and are typically saved in a ‘coding frame’ (also known as a coding dictionary or codebook). The coding frame lists all the codes you are using to analyse your data, with a definition for each code.
As you analyse your sources, a coding frame gives you a reference to identify which code your data relates to. If you are analysing your data over several days or sessions, the frame helps you to maintain consistency in your coding and to keep track of all the different codes.
Typically there are two approaches to choosing the codes you will use:
1 A pre-determined set of Codes
A coding frame is pre-prepared and you label all the data within your sources with those codes.
2 Developing your own Codes
You analyse your sources and identify your own codes relevant to your research question.
Developing your own codes allows you to really tailor your analysis, but it is an iterative process to ensure you identify codes that best represent your data.
Building your own Coding Frame
For your own codes, you will need to evolve your codes from scratch following an iterative process:
- Review your first Source
- Identify the information that relates to your research questions – typically a short section of text
- Assign a ‘Code (value)’ to that data representing the content,concept or idea in that data
- Add that Code into your Coding Frame with a definition
- Continue identifying data and creating relevant codes or labelling with existing codes for all relevant data in that source
- Review your next source
- Identify relevant information and allocate Tags (Labels/Codes) from those you have added into your Coding Frame
- If the Codes you’ve added don’t apply to data you have identified, add new codes, or adjust them
- Anytime you edit your coding frame, revisit the sources you have previously reviewed, using the most up to date coding frame
- Repeat to build your coding frame
Revisiting sources you have already coded ensures consistency and that any changes you have introduced by updating your coding frame are reflected in your data.
During this process the adjustments you make may remove or add codes and it may also group several codes together into one. Make sure to revise your code definitions and revisit all your Sources whenever changes are made until you have a set of codes that you aren’t tweaking.
How Specific should your codes be?
Your codes should be broad enough that they label multiple data points so that you are condensing the raw data from your sources, but not so broad there is lots of overlap with other codes. At the other end of the spectrum, they shouldn’t be so specific that they only apply to a handful of your collected data. It wouldn’t be helpful to have as many codes as there are data points collected!
Data Coding on Protolyst
To develop your own coding frame and analyse sources on Protolyst:
- Upload your sources into a Table
Add a New Page to your workspace, select type Table
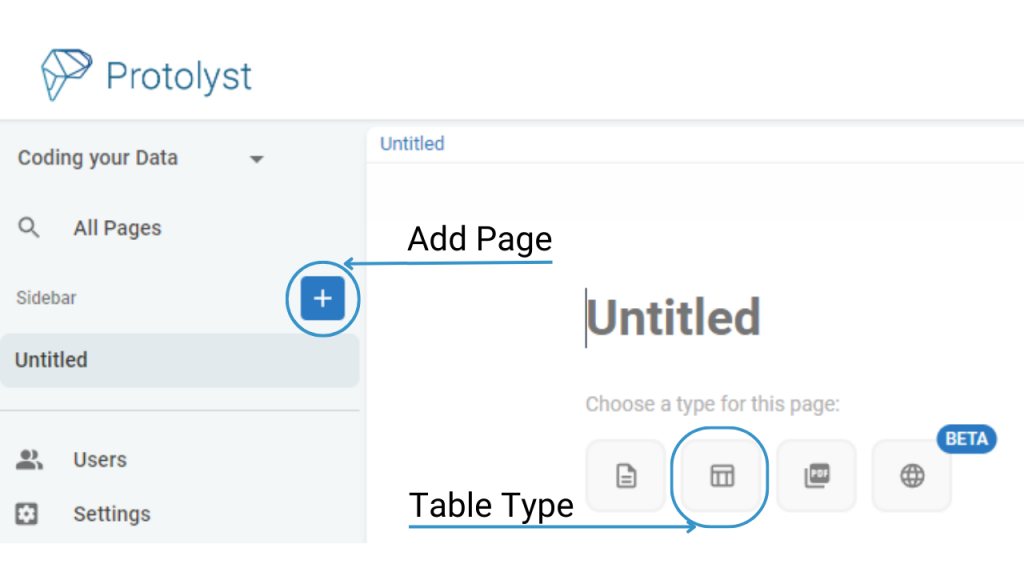
Upload your Sources into the Table by dragging and dropping your files onto the Table.
Tables by default have an Atoms and Sub-Pages Property. For this workflow you can ignore/delete Sub-Pages if you want
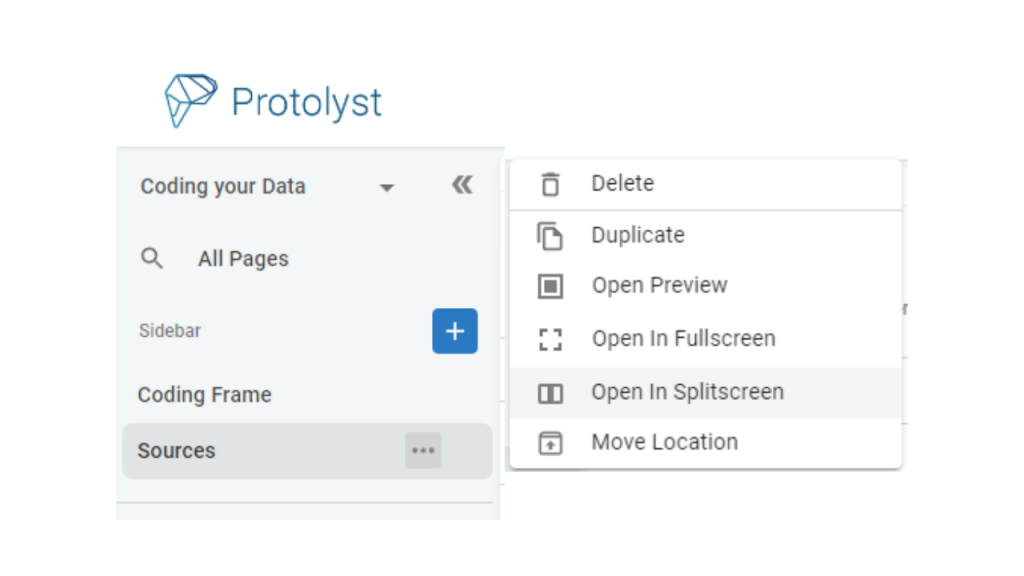
- Create your Coding Frame as another Table
Add another Table into your Workspace, this will be your Coding Frame

View your Sources Page and your Coding Frame side by side using Splitscreen
- Identify Relevant Data in your First Source and Create your First Code
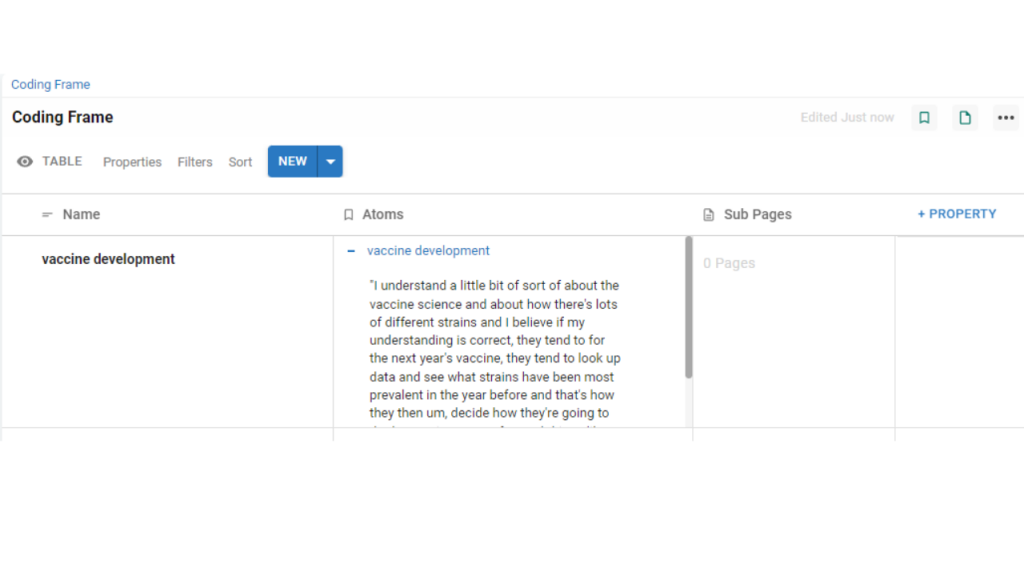
Open Source 1 – when you identify information relevant to your research questions, highlight that text and select ‘Capture Atom’
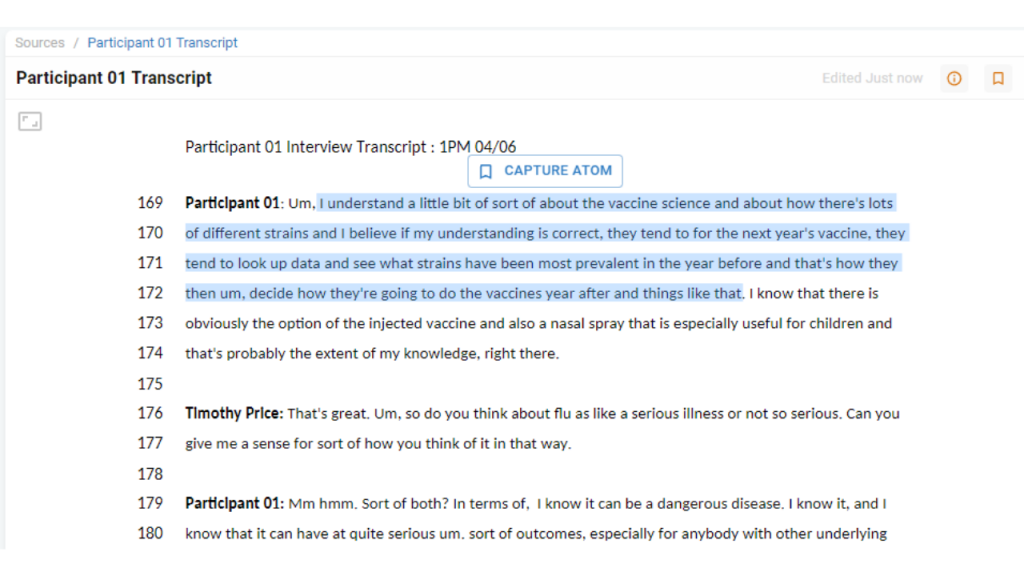
On Protolyst Atoms are the important details that you want to use and refer to. Saving you highlight as an Atom lifts the highlighted text out of the page for you to use and view across your workspace.
An Atom box will appear displaying the highlighted text. Above this is a bar where you can add your Tags (Tags = Labels) to your Atom.
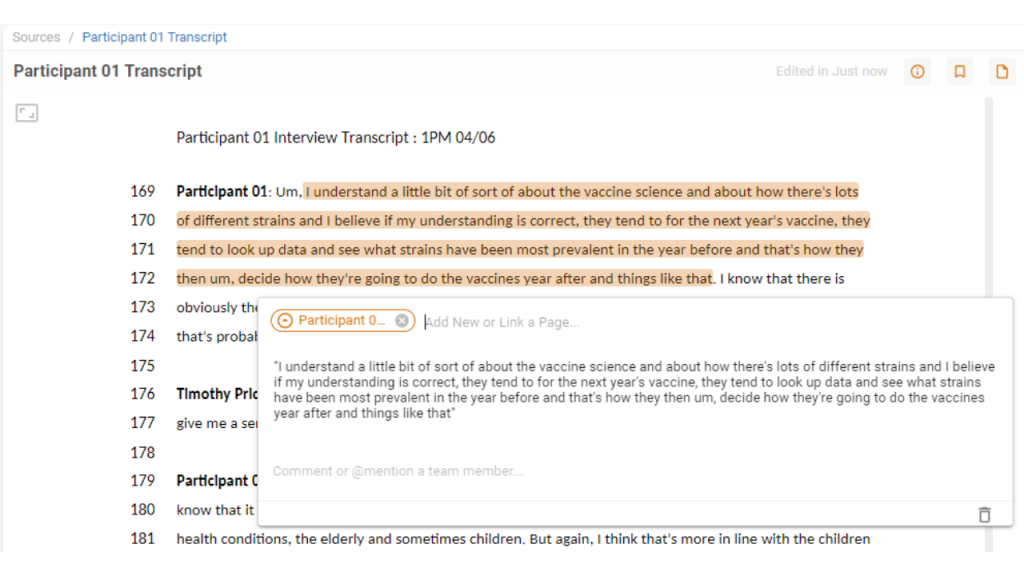
Review the information in your Atom and decide on a short phrase that describes the underlying content, concept or idea. Type this into the bar.
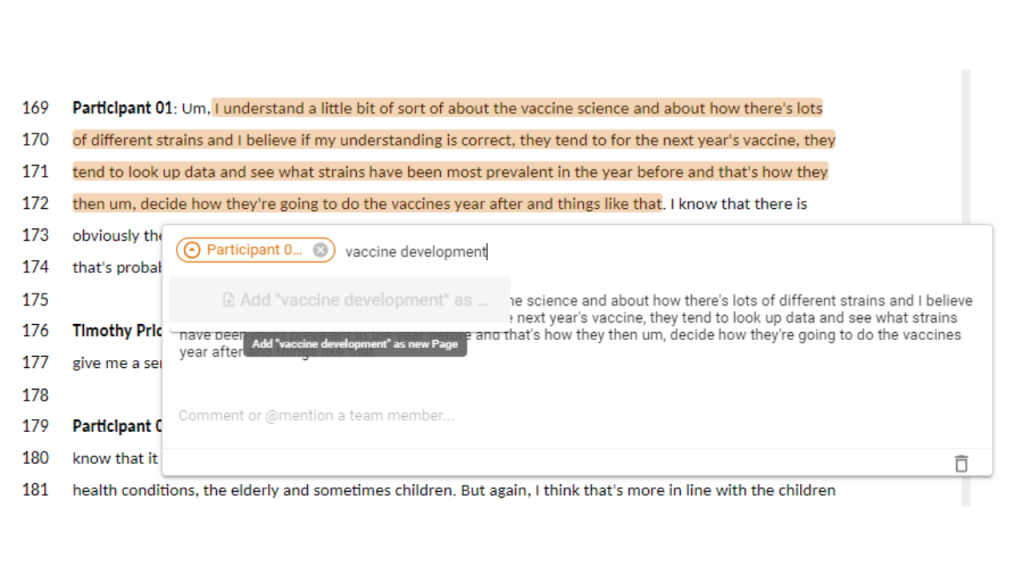
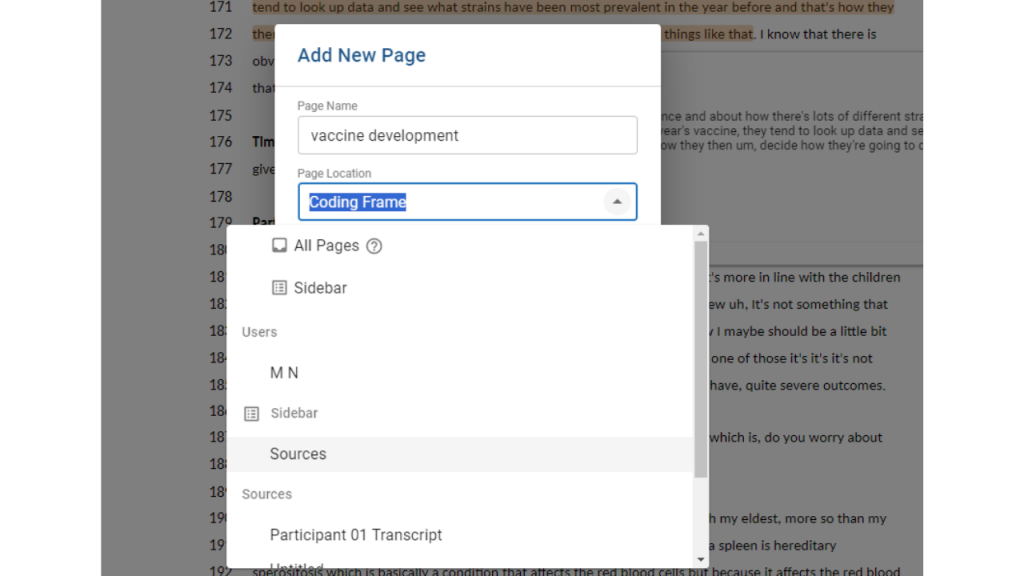
Select Add as New Page and Choose Coding Frame as the Location.
You will see the Code you just added appear in your Coding Frame Table and it will now display in the Bar above your Atom as a Tag (Label) for this data
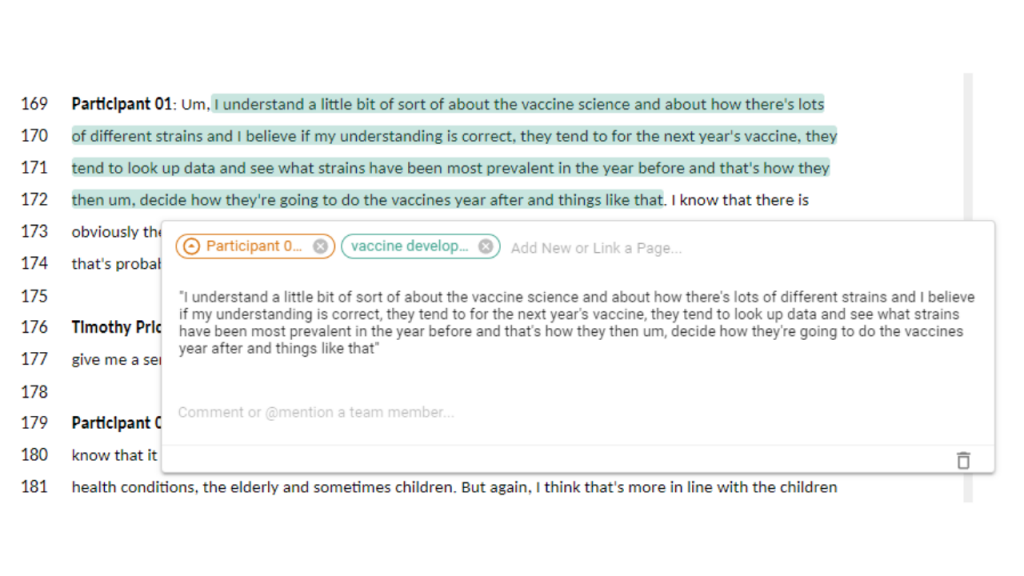
Tthe Atom also appears in the Atoms column next to the Tag in the Coding Frame Table
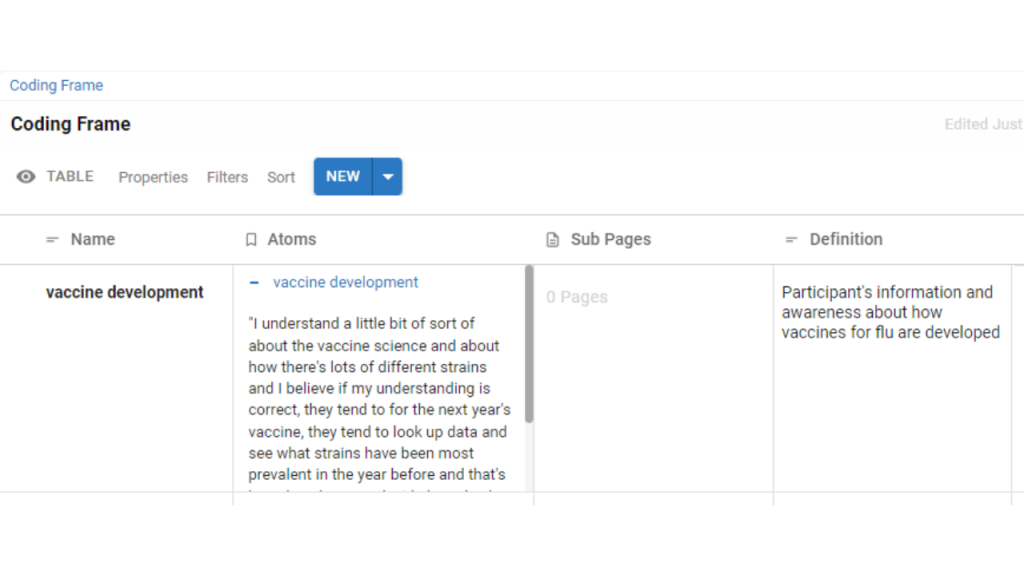
- Add a definition for your Code into your Coding Frame
Add a new property into your Table using the + Property button. The Button is located at the end of the Properties in your Table. Update the Property Title and add your definition for the Code
- Repeat for other data in the current Source
Create new Tags as needed following steps above. To add an existing Tag to your Atom, start typing the name or scroll through the list until you find the Tag.
- Repeat for other Sources to build and refine your coding frame
Remember to revisit earlier sources if you make any changes to your codes
Once you have finalised your Coding Frame, you can continue to analyse the rest of your Sources using these Tags. To edit the Names of any of your Codes, click in the Name box in the Coding Frame table and update it. Remember to revisit the sources you’ve already analysed to check the updates to your codes.
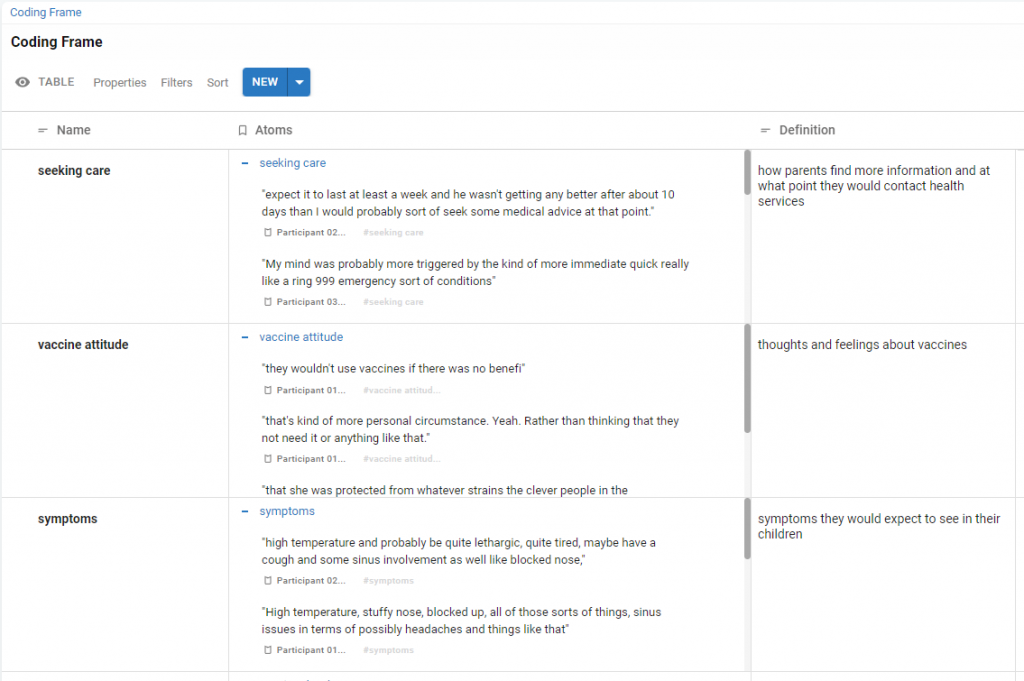
After you have completed your Coding for all your Sources, you can then review the data collected for each Tag to determine the nature of the patterns and trends within your data.
To view all the Data collected around your Tags, head to your Coding Frame. The Atoms Property will display all the Atoms collected and tagged to each of your Codes.
Data coding is a versatile technique for qualitative research supporting you to systematically analyse and interpret your data by transforming it into structured, interpretable information. Defining your own codes to label your data allows you to identify, probe and analyse the concepts and ideas in your datasets.
Protolyst One of 5 Sage Concept Grant Winners!
[…] you can seamlessly collect and organise individual highlights from your resources through data coding. Users have the flexibility to highlight data snippets from interview transcripts, meeting notes, […]