Tables are one of the Page Types on Protolyst, and operate as databases, giving you more opportunities to organise your information. Properties can be added to help with segmenting and categorising everything in a workspace.
Create a Table #
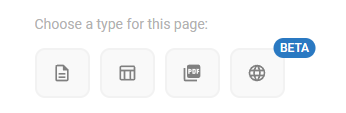
Add a New Page into your Workspace (using the Blue Button at the top of your Sidebar) and then choose Table Type.
All New Tables you add into your Workspace have 3 properties by default; Name, Sub-Pages and Atoms.
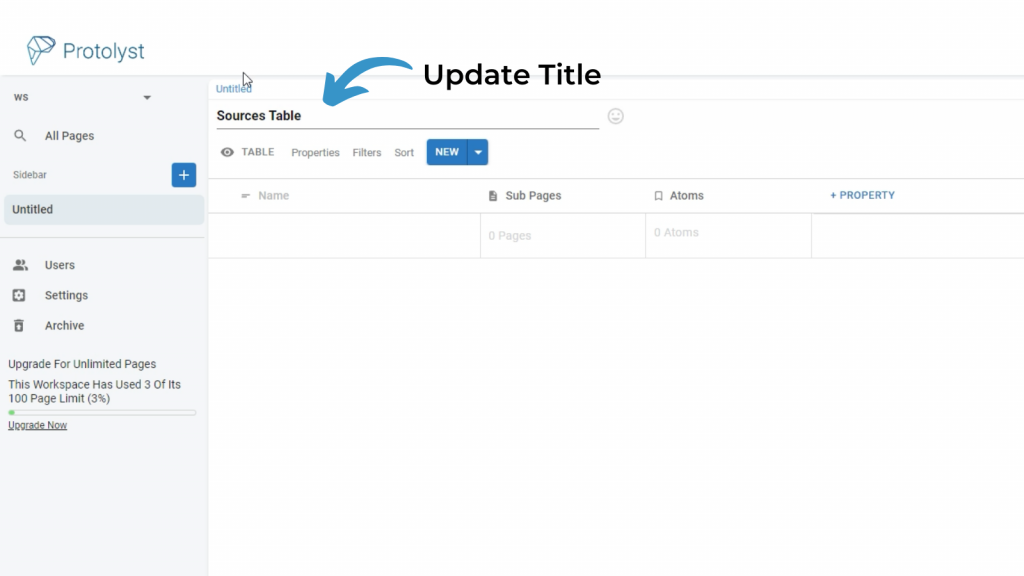
Every Row in a Table is a Page in your workspace. Name is the identifier or title of the Rows (Pages) in your Table, Sub-Pages displays any Pages that sit underneath the Row (Page), and the Atoms Property will display all the Atoms for a Row (Page) of the Table.
Table Properties #
In addition to Name, Sub-Pages and Atoms, there are several other Property Types available to use in your Table:
- Linked Pages: View a list of Pages that are linked to a Page
- Text: Type written information
- Select: Choose one option from a defined list
- Multi-Select: choose several options from a defined list
- Number: Use Numbers
- Image: Save Images
- Checkbox: For True/False on/off or yes/no
- Date: Select a date
- Rating: Star rating from 1 – 10
- Linked Table: Choose options that correspond to Rows in another Table in your Workspace
- Button: Perform a function from the available options
- Citation: Collect reference information for an uploaded file
- Created By: Display user inthe workspace who created the Page
- Date Created: Display the date the Page was created
- Last Edited: Display information about when the Page was last edited
Adding Properties #
To add another Property into your Table, use the + Property option, next to the last column in your Table. This will add another Property (Column) to your Table.
All new Properties are created as a Text Property. To swap to a different Property Type, click on the Column Title to open the Property Options, and then expand the dropdown to choose from the list of Properties.
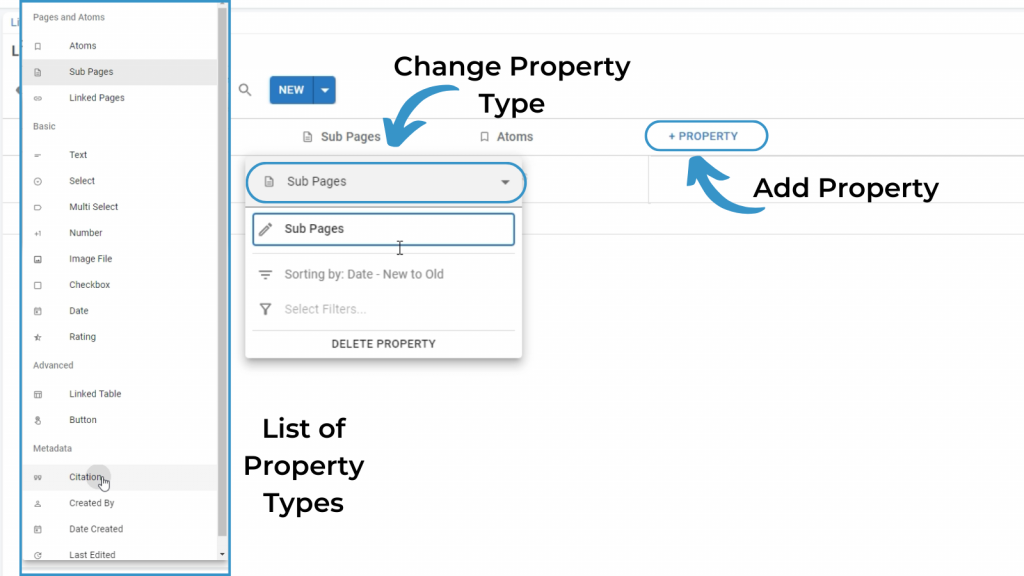
Edit the Title of your Column in the Property Options too.
Different Property Types will have different available Property Options in this menu.
Delete Properties #
To permanently remove Properties from your Table, click the Property Title to open the Property Options and then select Delete Property. You can also ‘hide‘ a column from view so it is not deleted but doesn’t display in your Table (see the section below)
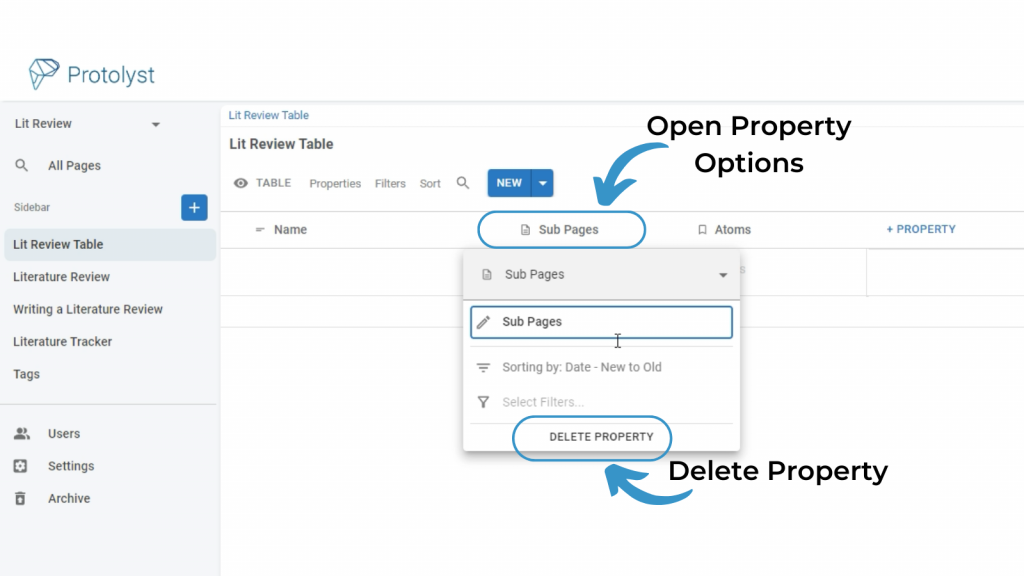
If you delete a Property, you will lose all the data added into that column in your Table. Deleting an Atoms or Sub-Page Property will not delete the Atoms and Sub-Pages.
Edit Properties #
You can open up the Property Options anytime to update the Property Title and/or change Property Type.
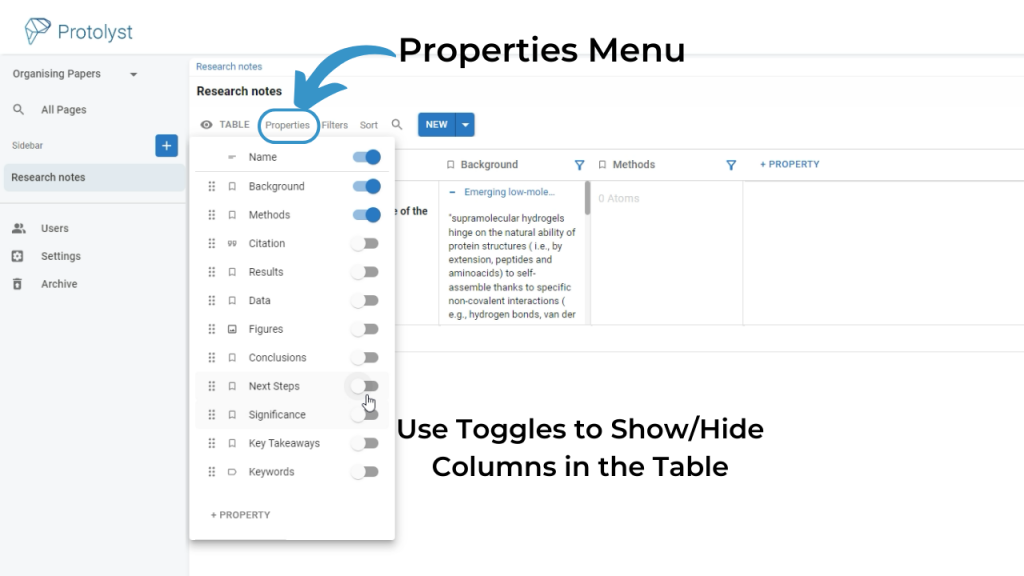
Selecting Properties on Display #
To change the Properties that display in your current view of the Table, open up the Table Properties Menu located above your Table.
From here you can toggle each Property on/off to show/hide it in the current View.
Adding Rows #
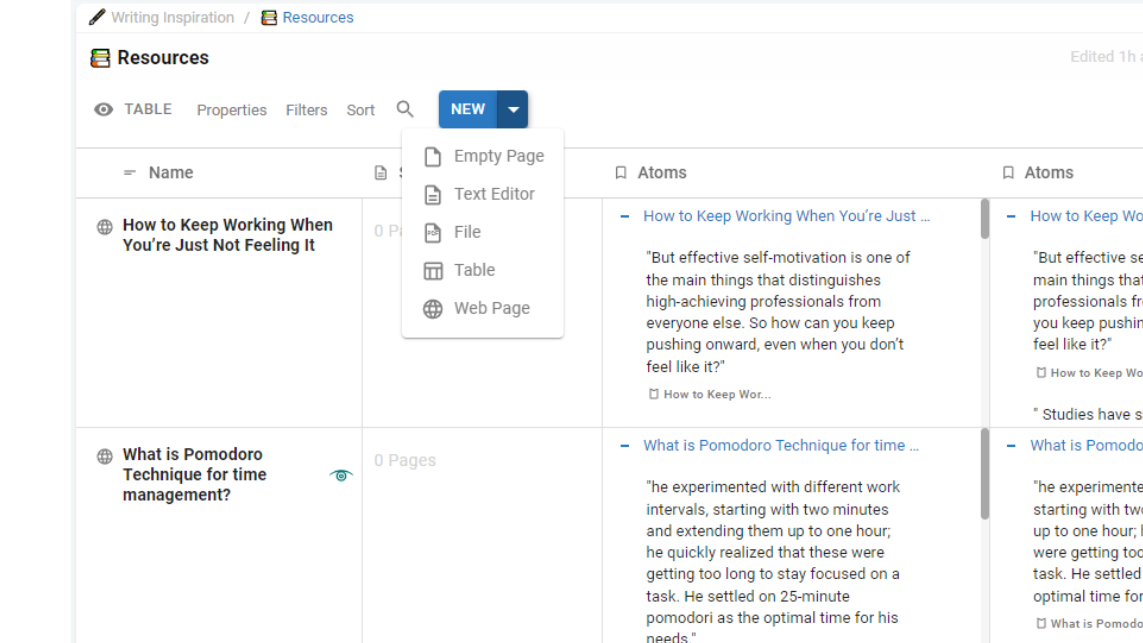
Add a Row to your Table using the New Button above the Table.
To add a particular Page as a New Row in your Table, use the Dropdown Next to New button and choose the Page Type. This will take you straight to the Page Type you have chosen.
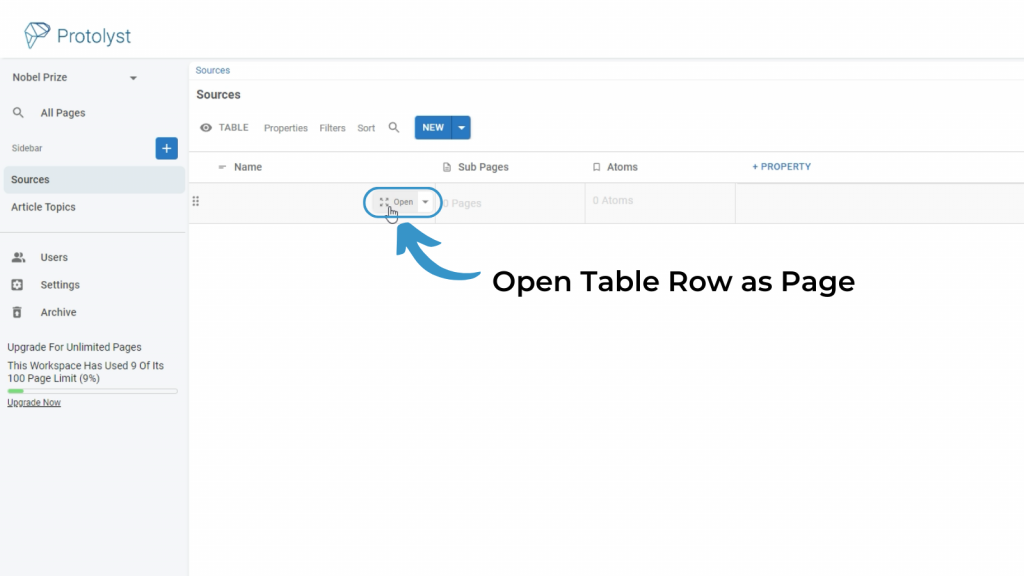
Each Row of your Table is a Page. To Open up and Set up that Page, hover over the name of your Row and then choose the Open Button. You’ll then be prompted to choose a Page Type.
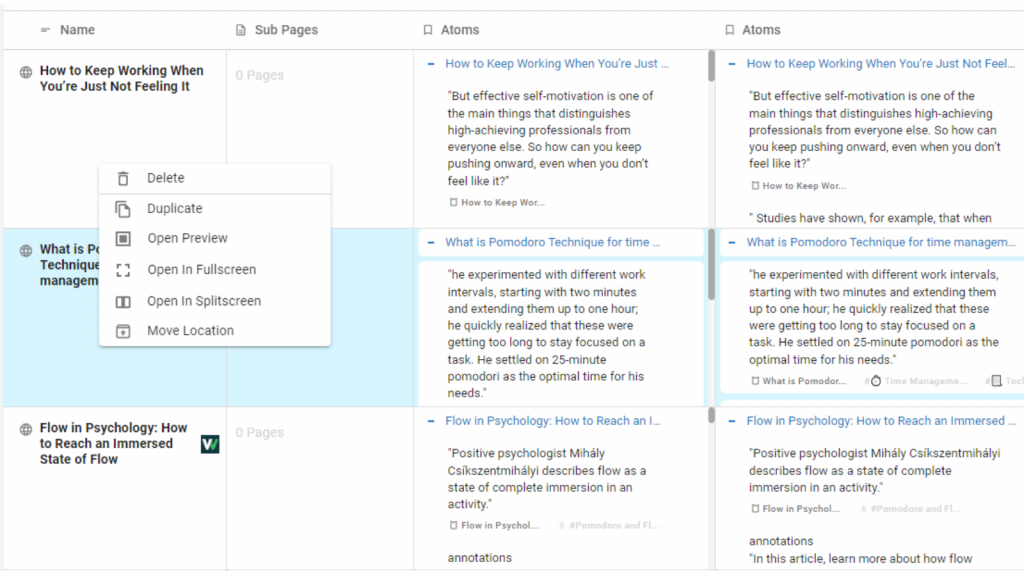
Deleting Rows #
To delete a Row of your Table, right click in the Name Property for that Row and select Delete from the available Options.
Math in Tables #
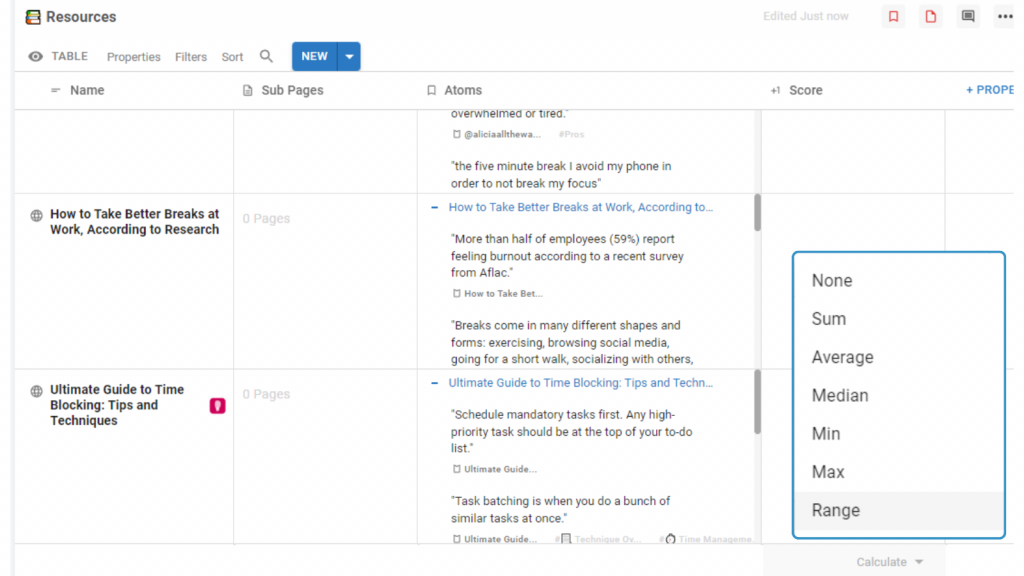
When you add a Number Property to your Table, underneath the bottom row, in the Table Footer, there are some mathematical functions you can use. Hover at the bottom of the row and you’ll see a Calculate Dropdown appear. Choose from the available functions to perform calculations on the column.
Once you have your Table and have populated it with Pages, you can organise your Table with Sorts and Filters to group and categorise the contents of your Table. You can save particular Properties, Filter and Sort combinations and also display the information in a Table as a Gallery, Chart or like a Document by using Table Views.
What next?


